by Ken Lopez
Founder & CEO
A2L Consulting
Terms like infographics, information graphics, and information design are easily confused. It's no wonder. There's not even consensus on the meanings of these terms, as they are relatively new.
Here's how I believe the terms are properly defined. Information design is a sub-specialty of graphic design that involves the creation of information graphics. Information graphics are visuals that are designed to quickly and clearly inform and possibly persuade the viewer.
For example, when we see a curvy arrow on a yellow sign while driving, we instantly know to be cautious of the twisty road ahead. Other examples of information graphics include subway maps, bus station routes, warning labels, sharable political charts or even an explanation of a complicated process.
Some litigation graphics can be properly called information graphics. They are those that are built to persuade as opposed to a simple enlargement of a document or photo. Generally speaking, these graphics are demonstrative evidence, and most demonstratives are information graphics.
Discussing information design without mentioning Yale University's Professor Edward Tufte is sacrilege in our industry. Author of several books on the topic, he is the modern guru of information design.
Infographics are a subcategory of information graphics. As the infographic to the right from marketing firm Customer Magnetism explains, infographics are data-rich visualizations designed to educate and inform.
About half of A2L's work is devoted the creation of litigation graphics with the rest focused on jury consulting and courtroom technology support. So, to tie all of these terms together in the context of our business, you could properly say that our team of information designers are expert in the art of information design, and their work often involves the creation of information graphics and even the occasional infographic.
Highly dense and data-rich infographics are not normally used in the courtroom where quick and clear messages are preferred. My view is that any particular demonstrative used in the courtroom should express one simple sentence (with no conjunctions).
When our information designers create infographics, they are usually being used as part of a lobbying effort or as advocacy graphics outside of the courtroom. Here, like in the image to the right, a typical infographic may express dozens of messages. Instead of expressing a single sentence, an infographic may express a paragraph or even a short story's worth of material.
Below are 15 infographics that relate to the legal industry. Some are focused on litigation, while others are about lawyers generally.
Clicking any of the infographics should bring up its original source and a larger image.
1. The Patent Lawsuit Economy: This infographic is a few years old but conveys some surprising information. My favorite statistic is that if all active patent cases were adjudicated in 2008, the total cost would have exceeded $31 billion dollars.
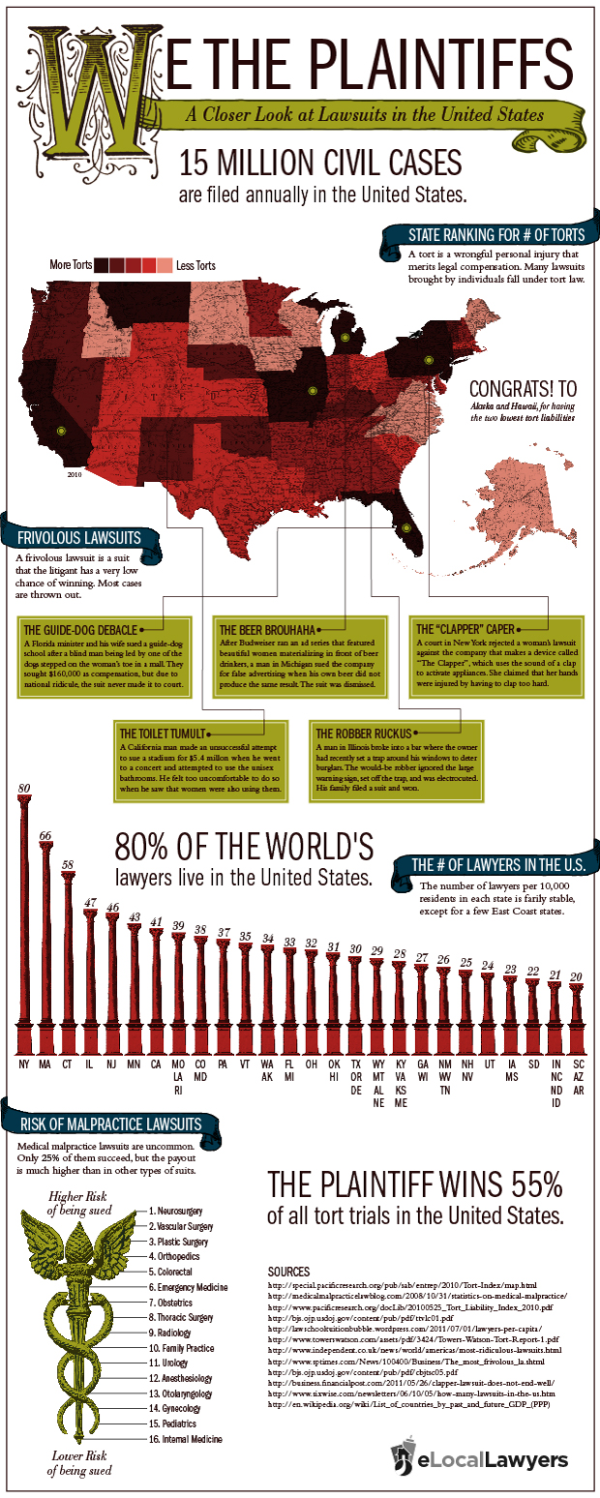
2. We the Plaintiffs: One of two infographics in this article that talks about the high number of lawsuits in the United States, it reminds us that 80% of the world's lawyers live in the United States. Unfortunately, on the number of lawyers per jurisdiction section, this infographic leaves off my hometown, Washington D.C., that boasts a shocking number of lawyers - 800 lawyers per 10,000 residents (10x of New York) or about 1 out of 13 people.
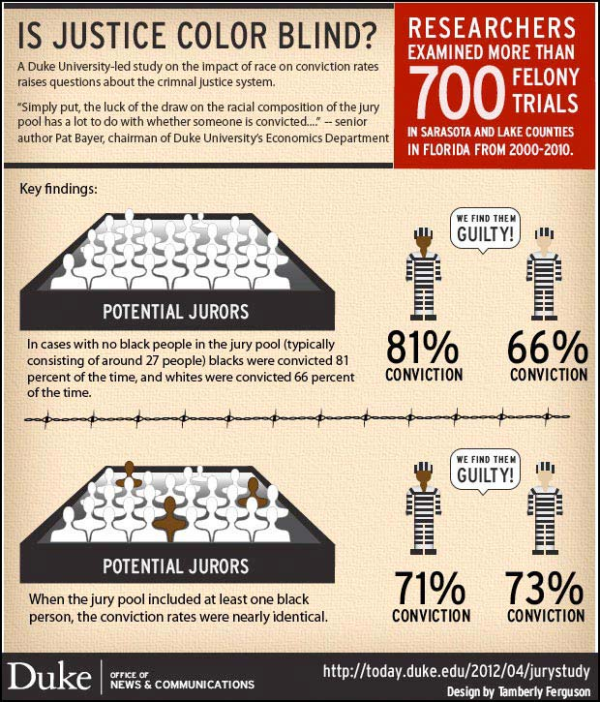
3. Is Justice Colorblind? This infographic tells a disturbing story based on a Duke University study. In a nutshell, the racial makeup of a jury affects conviction rates depending on whether the defendant is white or black.
4. Crimes Through Time: Like other infographics in this article, if you click on it, you can view a larger version.
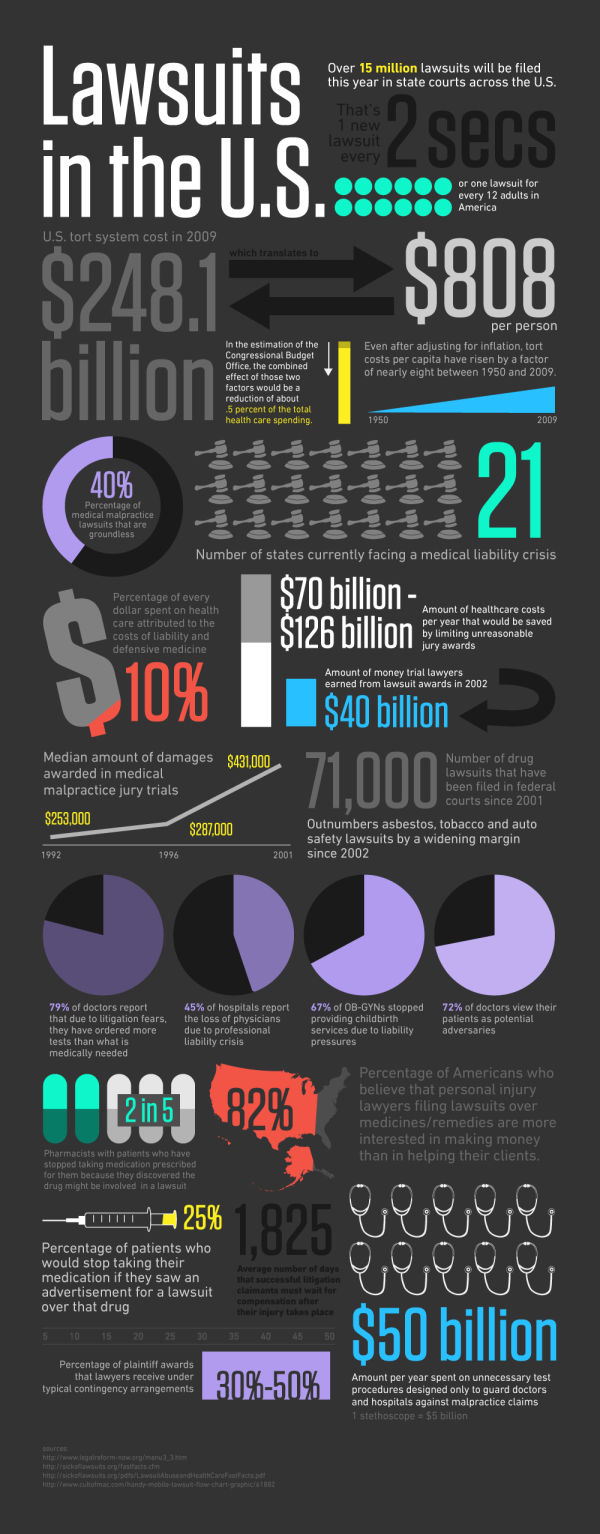
5. Lawsuits in the United States: While clearly advocating for tort reform, this infographic reminds us that a new lawsuit is filed in the United States every two seconds.
6. A Look Into Google's Various Legal Entanglements: One of several widely circulated charts that focus on Google, this information graphic clearly shows why Google is a good client to have.
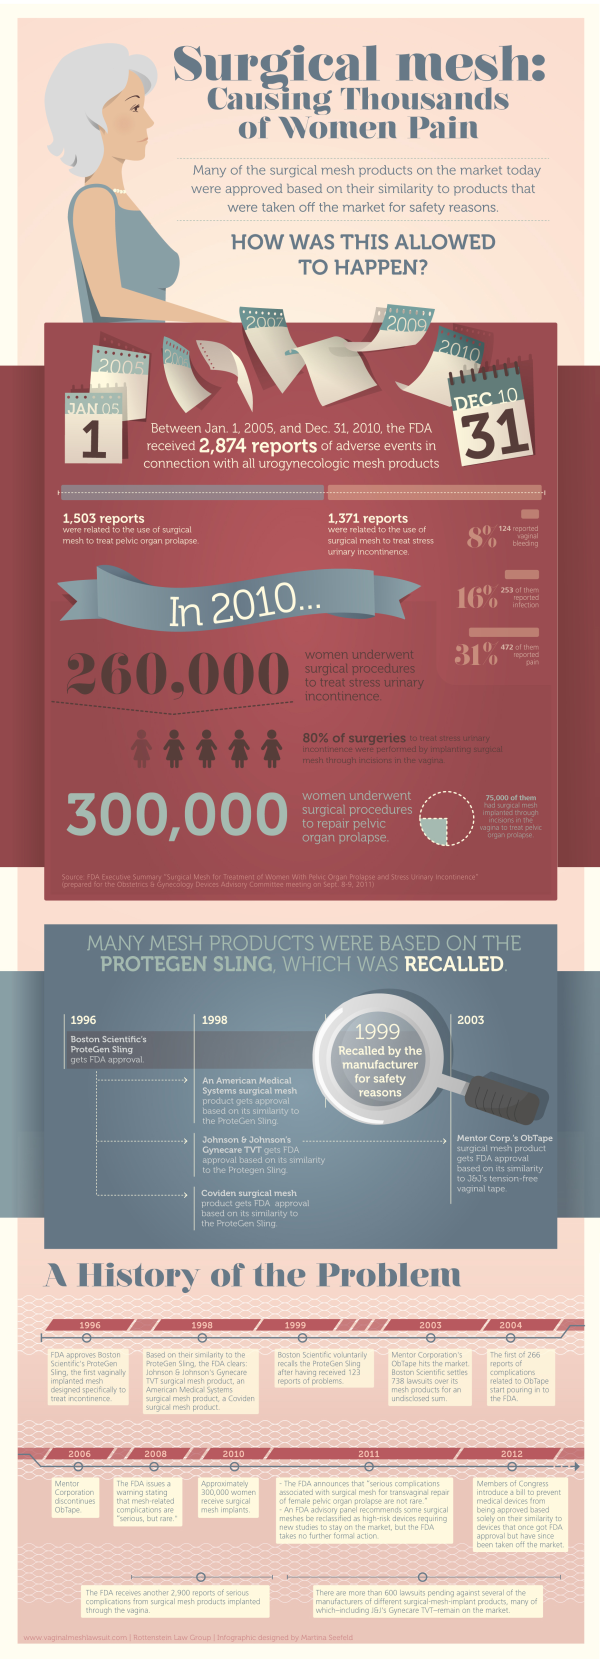
7. Surgical Mesh Litigation: Like many infographics, this one is really an advertisement in disguise. Yet, it is informative and points to the usefulness of infographics for quickly disseminating information and encourage action.
8. Lawyer Employment Levels: From this infographic we quickly see what we've all heard: new lawyers are having a tough go of it.
9. How Many Presidents Were Lawyers: Have you ever wondered which American presidents were lawyers? 26 out of 44 or 59 percent, it turns out.
10. Intellectual Property Law Explained Through Google: Sometimes the easiest way to learn something new is to put it in context. Here, this infographic provides a basic explanation of intellectual property law by using elements of Google as examples.
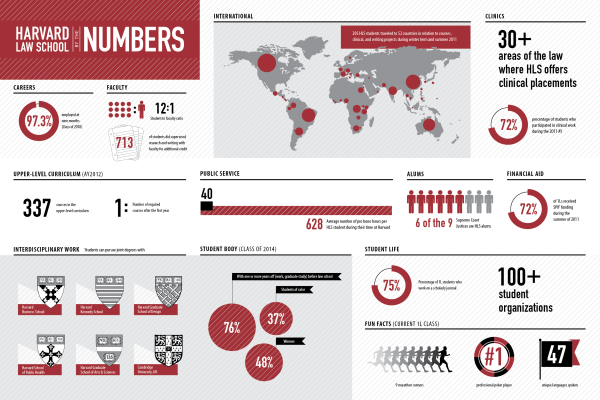
11. Havard Law School by the Numbers: This infographic is part of a book on infographics. Among the interesting statistics is the fact that 6 of 9 Supreme Court Justices are Harvard Law School graduates.
12. Drug Abuse Among Lawyers: Sadly, our profession is a stressful one, and that stress takes its toll on many lawyers.
13. Victories by Legal Underdogs: While our firm more often finds itself on the Goliath side of the equation, this infographic reminds us of interesting David vs. Goliath cases, lucha libre style.
14. The Law School Bubble: Another scary infographic about the state of the legal economy for law students.
15. The Most Influential Legal Cases of the Last Century: In spite of some scary infographics about troubles in the profession, this one reminds us of the good lawyers do.
Other resources related to infographics, information graphics and litigation graphics generally:
- Explaining a complicated process with trial graphics
- Download a free litigation e-book
- History of information design and litigation graphics
- 5 great information design sites for lawyers and litigators
- Our litigation graphics consulting services
- Information graphics for lobbying and advocacy presentations








Leave a Comment