Many antitrust cases involve potential damages of hundreds of millions or even billions of dollars. Cases can arise when one company sues another for violating the antitrust laws and causing economic harm to the plaintiff, or the government (U.S. Department of Justice, Federal Trade Commission, or state attorney general) can bring a case seeking money damages, an injunction, and other remedies. Price-fixing charges can even be brought as a criminal case by the Justice Department.
The antitrust laws prohibit both price-fixing by competitors and monopolization of a market by a single company, and both of those types of cases can be well illustrated by antitrust litigation graphics.
These cases involve complicated terms and issues such as market power, potential competition, and market definition that lawyers and economists have argued about for generations. But since they involve buying and selling, activities that jurors are familiar with, these concepts can actually be illustrated quite effectively by using analogies from daily life.
In a variety of cases, we have sometimes worked with lawyers who want to show that a company or a group of companies acted illegally to raise prices and hurt consumers in their pocketbooks, and we have sometimes worked with lawyers representing clients that are defending themselves against such accusations.
In the below movie, we portrayed a price-fixing conspiracy as a web, which is something that jurors understand well and is also a term that is used in the case literature to describe antitrust conspiracies. After the jurors have seen the web, they then see that it raised prices by a total of $740 million and caused harm to consumers.
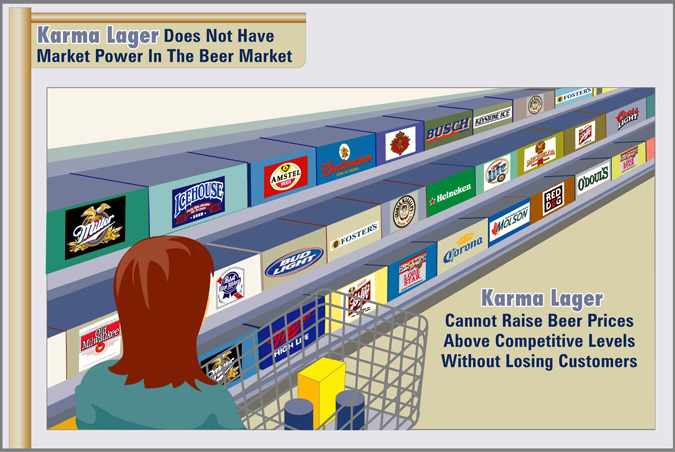
In the next exhibit, we were attempting to show that Karma lager, a brand of beer, does not have market power in the beer market. What better way to do this than to show a shopper faced with dozens of choices in the beer aisle? Jurors see recognizable names there such as Miller, Heineken and Corona and come to the conclusion that a single player in the market would be unable to act so as to raise prices above competitive levels without losing customers.
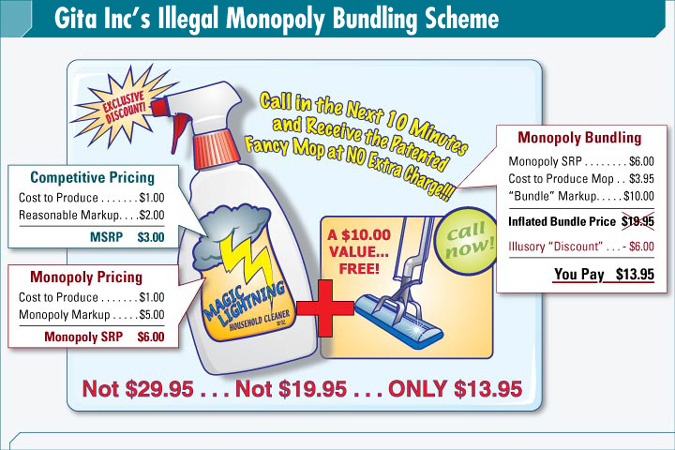
In the final exhibit, we are illustrating the effects of an illegal “bundling scheme” perpetrated by a monopolist. Here, we analogize it to a late-night television commercial for a cleaning product. Not only does the graphic illustrate the economic principle of reasonable markups versus monopoly prices, but it also associates the defendant with TV hucksters, not a popular set of individuals in the mind of a juror.
“Call in the next 10 minutes and Receive the Patented Fancy Mop at NO Extra Charge!!!” is the type of pitch that many jurors will have heard and disdained. Here, we associate the monopolist in this case with that type of economic behavior.
Using trial graphics in antitrust litigation is a must. The subjects of economics and mathematics are intimidating to most jurors and are a fundamental part of every antitrust case.
Many trial teams or antitrust experts/economists inadvertantly overwhelm a jury with one Excel bar chart after another. I believe this serves only to confuse the jury further -- since after you seen ten Excel bar charts, they all start to look pretty much the same.
Instead of focusing on bar charts, focus on the drama of the story. You want the jury to trust your client(s) -- or better yet -- distrust the opposition. Then, use stand-out litigation graphics that sharply contrast with your bar chart exhibits to highlight the key elements of your case.


Leave a Comment