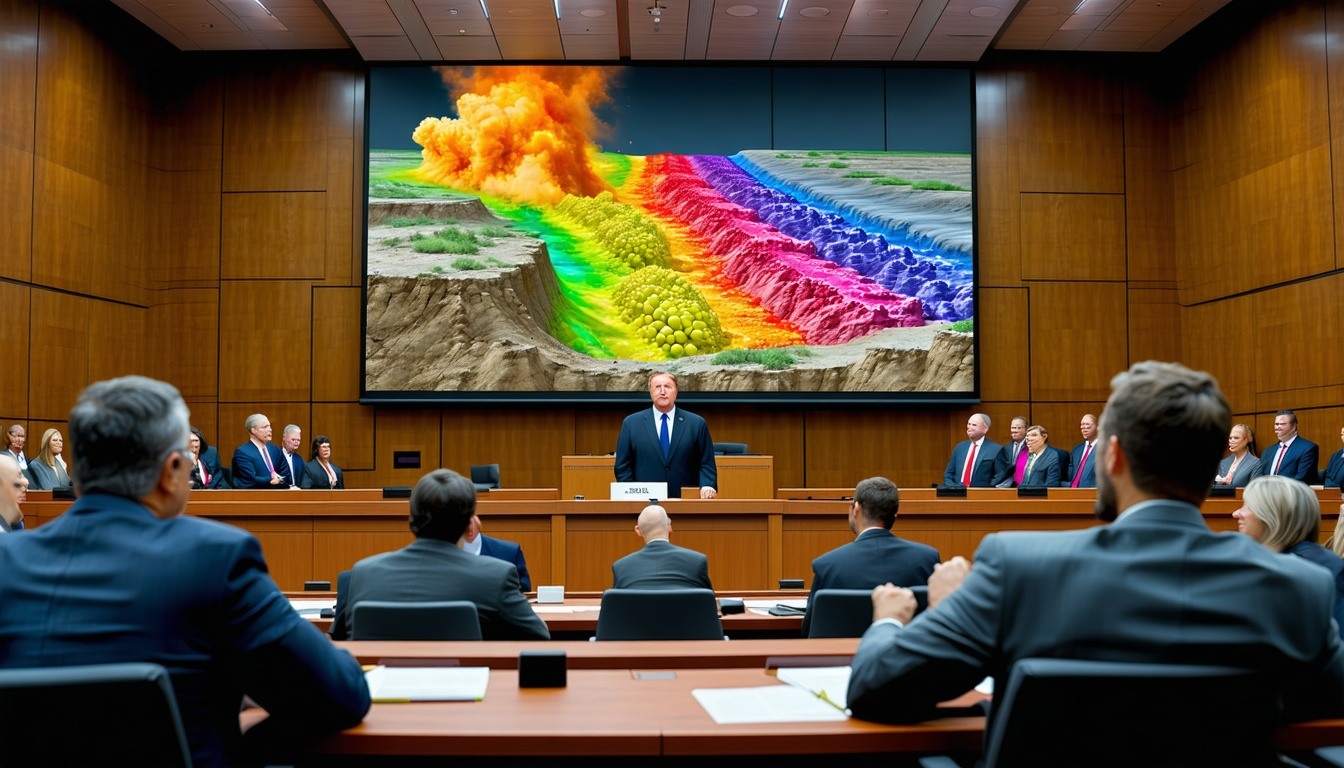
In a trial in which harm to the environment is at issue, the major challenge for any litigator is to present complex scientific information in a way that is easy for an average person to understand. For our litigation graphics consultants, this is true whether we are helping to represent an alleged polluter against a landowner or other person who alleges environmental damage, or whether it’s an insurance coverage case in which our client is asking an insurer to cover a claim under a business insurance policy.
In many cases, the task is further complicated by the fact that environmental harm occurs over a period of years or even decades. In such situations, it is crucial to show not only how the damage occurred initially but how it became more serious, or less serious, over a period of time.
Both sides in a major environmental case usually bring in environmental experts to help explain their side of the case to the jury. However, these experts are trained in science and engineering, not in information design, so their testimony, however scientifically compelling, may be presented in a way that is too complex to appeal to jurors. An astute expert knows that their testimony can be bolstered by the inclusion of a visual presentation and trial graphics.
Neil Shifrin, Ph.D., a Director at Gnarus Advisors LLC, a leading consulting firm specializing in expert analysis, litigation testimony and business advisory, says, “Clear, graphical presentations of complex scientific information can be critical to judge and jury understanding. Graphical portrayals are almost always superior to tabulated information, but the challenge is to keep it accurate while making it interesting and most pertinent. In court, it is true that a (good) picture is worth a thousand words.”
For example, Animators at Law produced a 3-D animation for an insurance coverage mediation. This showed that one block in a tank had been installed sideways by the property owner. As a result, oil, solvents and cleaning agents leaked into the spaces between cinder blocks over a period of time. Because this graphic was intended for a mediation, not a court case, we were free to use a glowing green color to highlight the pollutants – a feature that would have been considered overly prejudicial in a jury trial under Rule 403.
In another case, we used a three-dimensional cross-section to show the path that PCE (perchloroethene) plume took when it was released into the environment and how it ultimately contaminated the bedrock in the area and the water supply. This exhibit was built in PowerPoint and combines 3-D technical illustration with PowerPoint to create an animated effect in a cost effective manner.
Finally, in yet another case our task was to show that a particular piece of land was not a wetland under the applicable law. We used animated bar graphs to show water levels at test wells. These showed that groundwater did not stay close enough to the surface for the area to be considered a wetland. The key to this exhibit was that it was not static in time. It used data taken from several consecutive years to show a moving water level that at no point reached the required level of one foot.
In each of these examples, complex concepts were distilled down to an easily digestible level using trial exhibits. Care should be taken in environmental litigation to ensure that any judge or juror can quickly understand the information being presented.


Leave a Comment