In trial presentation graphics, a great deal can depend on the quantity of data that is presented to the jury and on the way in which it is presented.
For example, it has become conventional wisdom that humans generate pollution in the form of carbon dioxide, that carbon dioxide and other pollutants cause a greenhouse effect on the planet, and that this effect noticeably raises global temperatures and/or causes climate change. Al Gore's movie, An Inconvenient Truth, cemented this belief in the minds of the public and future jurors, largely through the use of effective visual presentations.
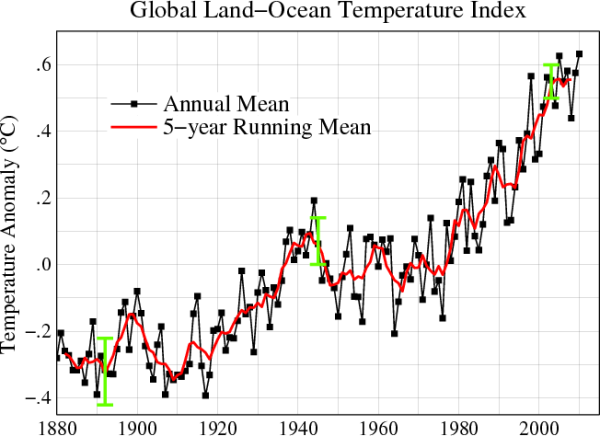
The U.S. Government chart below captures the conventional wisdom well. As large quantities of carbon dioxide entered the atmosphere with rapid industrialization in the past 100 years or so, global temperatures went up, it shows.

Because of the recent rapid spread of the conventional wisdom, as illustrated in charts like this one, it has become almost unthinkable to suggest an alternative. But in the trial context, it can be necessary to do just that.
Climate change litigation is making its way through court systems around the world. The targets can be government agencies or large power companies, especially the coal-fired power plant industry. Should a jury be called upon to decide such a case, conventional wisdom will be on the side of the plaintiffs. But the defendants are entitled to show their version of the world’s fluctuations in average temperature – without falsifying facts, of course.
The answer is to add more data that can call into question the conventional wisdom. Changing the scale of the horizontal and vertical axes can change the climate story.
We believe the above 2.5-minute PowerPoint presentation goes a long way toward making the defendant's case that global warming of human origin is not a scientific certainty. By expanding the time frame from 120 years or 1,000 years to 800,000 years or even more, this trial presentation graphic tells a different story from the conventional wisdom.
In the courtroom, our goal in using such trial exhibits would be to create enough doubt about the plaintiff's case so that a jury cannot reasonably award money to the plaintiff. Using additional data from scientifically valid sources and from paleoclimatologists, telling this story in way that creates doubt is possible.
Our point in creating these trial presentation graphics is not to disprove climate change. Rather, our goal is to show how even the most skeptical viewer can be persuaded through the use of effective presentation graphics. Wasn't that part of what Al Gore taught us all?
We are in the business of telling the right story, our client's story. You can almost hear the closing argument that a defendant’s lawyer would make: "More data is better, isn’t it? Does the other side want you to look at less data? Do they want to hide the whole truth, inconvenient though it is?”
We welcome your feedback and encourage your comments below.


Leave a Comment